Artigos
An Agribusiness Over R$ 10 Billion: The Brazilian State Of São Paulo
The primary objective of this paper is to select the leading agricultural activities and to assess theirs distribution among the 40 Rural Development Offices (EDR) in São Paulo State .The specific objectives of this study are: (1) to identify the distribution of the total agricultural productions values of the 28 leading activities among the Rural Development Offices (EDR); (2) to identify the most important leading activity in each EDR, and (3) to classify the leading activities all
over the State of São Paulo. An Overview São
Paulo comprises an area of 247,898 square kilometers located within the
southeast region of Brazil. The state lies between latitude 20 degree and
25-degree south and meridian 44-degree to 53-degree west. Its southeastern
border is the Atlantic Ocean and its western border extends nearly to the
country of Paraguay. Results and Conclusions This articles relied primarily on planted area and production data supplied by the São Paulo's Secretary of Agricultural, especially the Institute of Agricultural Economics (IEA) jointly with Coordination of Technical Assistance (CATI). The prices for the farmers come from a monthly survey based on 731 strategic point distributed all over the 645 counties (municípios) of São Paulo assorted in 40 Rural Development Offices (EDR). The computer program VALPROD allows the estimation of the production values depending upon the aggregate concern, such as county, EDR, state and others.
A peculiar geographic feature influences the climate – an extensive mountain
formation, which is, parallels the coast. A humid-tropical coastal plain lies
between this mountain range and the ocean, while the areas to the north and west
of the range are characterized by rolling plains and a sub-tropical climate.
Seasonal changes are apparent in the plain region of the state, and winter
temperatures can fall to freezing levels. Most of the rainfall occurs between
October and March with annual precipitation averaging 1,300 millimeters.
In its native state virtually all of the area now comprising São Paulo was
covered with dense forests. For this reason soils have been relatively high in
humus and generally quite fertile in many region of the State and jointly with
the great climate diversity, production possibilities exist for a wide range of
agricultural products.
A characteristic observed throughout the Brazilian economy has been the
spectacular growth of the industrial sector and the long-term agriculture sector
decline relative to its national income contribution.
The Brazilian gross national income has increased from US$ 45,107 million (1970)
to U$ 804,182 (1997), while São Paulo State contribution to national income was
over 39,00% during 1970-75 and it declined to 35,48% in 1997 (Table I) . São
Paulo is still leading as the greatest contributor of value added tax (ICMS)
which has steadily been decreasing from 47,31% (1974) to 37,18% (1999) and its
contribution was greater than the total contribution of four Brazilian regions:
North, Northeast, South, and Center-West. Over and above that São Paulo ICMS
participation has been shortening with total levy of ICMS around US$ 39,00
billion.
When the oil crisis began in 1973, the São Paulo State Government took a
remarkable advantage by promoting the PROÁLCOOL program (1975) in order to
rearrange the land use toward an alcohol production to replace oil importation,
which started a profound change not only in the agricultural sector but also in
the industry and service sectors.
The sugar-cane started to play a more important role in the São Paulo State
economy, since it jumped its participation in the leading agricultural product
value from 12,16% (1974) to over 30,00% during the 1990s. The sugar-cane yield
has been steady 78.5 tons per hectare with a sugar production around 8.0 billion
of tons and an alcohol production of 8.86 liters.
The cropped total area in São Paulo State is around 20 million of hectares and
pasture occupies over 10 millions of hectare with 12.7 million of head cattle.
São Paulo agriculture is outstanding with fertile soils and adequate weather
that allows the planting of crops from different climates, such as coffee and
wheat.
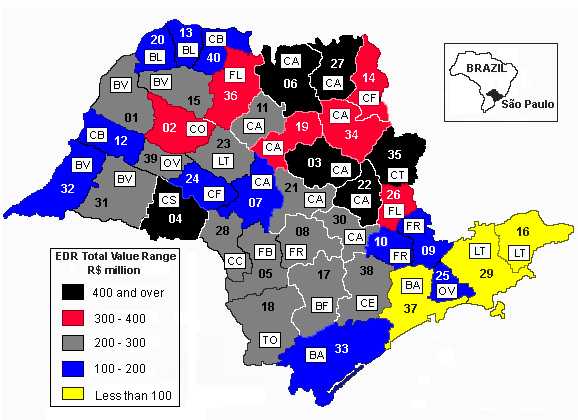
An activity becomes the most important activity (MIA) or the main activity , when one or two activities sum up more than 30.00% EDR production total values. A closer look in figure 1 reveals several informations about activity production total values (VP) among the 40 EDR.The numbers inside of the map identify where the EDR is locate, that is 33- Registro is on the South, 16- Guaratinguetá is on the East and 32-Presidente Wenceslau is on the West. It shows the delineation of the 40 EDR and the letters inside the EDR represents the MIA, that is in the 33-Registro the letters BA are Bananas, the letters inside 35- São João da Boa Vista CT are Coffee and Potato . Figure 1 shows how the 28-activity production total value of the EDRs is distributed along the State according to the grade differentiation. Table II summarizes the descriptive tabulation of the 40 Rural Development Offices (EDR) numbers and leading activities total values. Twelve EDR respond for 49.37% of São Paulo activity production total values and each one of these had a total values over R$ 300 million. Twenty - five EDR are in the range over R$ 100 million to less than R$ 200 million which represent 49.14 % of VP.
Table III lists the 40-EDR according to the VP and the MIA. The highest-ranking EDR was 35- São João da Boa Vista with a VP of R$618.139 million that represented 6.17% VP. The MIA was Coffee and Potatoes with R$216.662 million that represented 35.05% of this EDR. With a VP over R$303.1 were 03-Araraquara, 06-Barretos, 27-Orlandia, 04-Assis, 22-Limeira, 34-Ribeirão Preto, 36-São José do Rio Preto, 2- Araçatuba, 26-Mogi Mirim and 14-Franca (they were located at Northeast of São Paulo State except 04-Assis and 2- Araçatuba), worthwile to notice that 12 EDRs were responsible for 49.37% of the State
production total values.
Sugar cane was MIA in 15 EDRs, beef was MIA in 9 EDRs, milk was MIA in 5 EDRs and coffee and chicken were MIA in 3 EDRs.
Table IV shows how the 28 leading activity production total values have evolved in the 1996/97, 1997/98,and 1998/99 cropped years, particularly noteworthy the participation in the last year of eight activities over 5.00% each , that is sugar-cane (23.44%), beef (10.75%), chicken (8.25%), industry orange (6.68%), coffee (6.47%), eggs (6.11%), type C milk (5.90%) and corn (5.57%). The sugar cane has been the dominat activity, although it has decreased from R$ 3.77 billion (1996/97) to R$ 2.35 billion (1998/99, 1 dollar = R$1.85). Worthwhile to notice that sugar -cane is the most important activity in 15 EDR. The beef activity has been the second most
important, a total value over R$ 1.07 billion and jointly with sugar-cane
represent 34.19% of the São Paulo leading agricultural activity total
values.
Contribution to Brazilian Gross National Product in the years 1970, 1975, 1980, 1985, 1990 and 1997.
(Percentage)
| Sector | 1970 | 1975 | 1980 | 1985 | 1990 | 1997 |
| Agricultural | 5,72 | 4,98 | 3,54 | 5,15 | 4,58 | 4,70 |
| Industry | 43,85 | 44,33 | 44,49 | 39,79 | 37,42 | 36,39 |
| Service | 50,43 | 50,69 | 51,97 | 55,06 | 58,00 | 58,91 |
| São Paulo Contribution in Brazilian Gross Product | 39,43 | 39,19 | 37,49 | 36,12 | 37,02 | 35,48 |
| Brazilian Gross Product a | 45,017 | 137,272 | 250,315 | 210,844 | 469,318 | 804,182 |
a In US$ billion. Aucthors’s computation.
Rural Development Offices (EDR): Main Activities:
| 01 – Andradina | 21 - Jaú |
|
Bananas | |
| 02 – Araçatuba | 22 - Limeira |
|
Potato + Beans | |
| 03 – Araraquara | 23 - Lins |
|
Beef+Milk | |
| 04 – Assis | 24 - Marília |
|
Beans | |
| 05 – Avaré | 25 - Moji das Cruzes |
|
Sugar Cane | |
| 06 – Barretos | 26 - Mogi-Mirim |
|
Sugar Cane+Beef | |
| 07 – Bauru | 27 - Orlândia |
|
Sugar Cane + Coffee | |
| 08 – Botucatu | 28 - Ourinhos |
|
Onion | |
| 09 - Bragança Paulista | 29 - Pindamonhangaba |
|
Coffee | |
| 10 – Campinas | 30 - Piracicaba |
|
Sugar Cane + Eggs | |
| 11 – Catanduva | 31 - Presidente Prudente |
|
Sugar Cane + Soybeans | |
| 12 – Dracena | 32 - Presidente Wenceslau |
|
Coffee + Potaoes | |
| 13 – Fernadópolis | 33 - Registro |
|
Beans + Beef | |
| 14 – Franca | 34-- Ribeirão Preto |
|
Chicken + Orange | |
| 15 - General Salgado | 35 - São João da Boa Vista |
|
Chicken | |
| 16 – Guaratinguetá | 36 - São José do Rio Preto |
|
Orange | |
| 17 – Itapetininga | 37 - São Paulo |
|
Milk | |
| 18 – Itapeva | 38 - Sorocaba |
|
Eggs | |
| 19 – Jaboticabal | 39 - Tupã |
|
Tomatoes | |
| 20 – Jales | 40 - Votuporanga |
TABLE II. Descriptive Tabulation of the 40 Rural Development Office (EDR) Numbers and the 28 Leading Activity Production Total Values, 1998/999 Cropped Year.
|
|
|
| |||
| R$ million |
|
Percentage |
Cumulative % | Percentage | Cumulative % |
| 400 and over |
6 |
15.00 |
15.00 |
28.73 |
28.73 |
| 300-less 400 |
6 |
15.00 |
30.00 |
20.64 |
49.37 |
| 200-less 300 |
14 |
35.00 |
65.00 |
34.16 |
83.52 |
| 100-less 200 |
11 |
27.50 |
92.50 |
14.98 |
98.49 |
| Less than 100 |
3 |
7.50 |
100.00 |
1.49 |
100.00 |
Table III The Rural Development Office (EDR) Main Activity (MIA) and 28 Leading Activity Production Values in the EDR (VPj) over São Paulo State, 19978/99 Cropped Year a.
|
|
|
|
|
|
|
|
| 35 - SAO JOAO DA BOA VISTA | Coffee +Potatoes |
216.662 |
35,05 |
618.139 |
6,17 |
6,17 |
| 03 – ARARAQUARA | Sugar-cane |
169.148 |
32,56 |
519.414 |
5,19 |
11,36 |
| 06 – BARRETOS | Sugar-cane |
162.410 |
33,43 |
485.802 |
4,85 |
16,21 |
| 27 – ORLANDIA | Sugar-cane |
237.759 |
55,42 |
429.000 |
4,28 |
20,49 |
| 04 – ASSIS | Sugar-cane + Soybean |
229.329 |
54,38 |
421.664 |
4,21 |
24,70 |
| 22 – LIMEIRA | Sugar-cane |
125.448 |
31,04 |
404.033 |
4,03 |
28,74 |
| 34 - RIBEIRAO PRETO | Sugar-cane |
269.036 |
67,45 |
398.821 |
3,98 |
32,72 |
| 19 - JABOTICABAL | Sugar-cane |
143.680 |
37,89 |
379.185 |
3,79 |
36,51 |
| 36 - SAO JOSE DO RIO PRETO | Chicken + Industry Orange |
113.496 |
33,47 |
339.084 |
3,39 |
39,89 |
| 02 - ARACATUBA | Eggs + Sugar-cane |
160.576 |
48,13 |
333.630 |
3,33 |
43,22 |
| 26 - MOGI MIRIM | Industry Orange + Chicken |
98.728 |
31,60 |
312.408 |
3,12 |
46,34 |
| 14 - FRANCA | Coffee |
134.379 |
44,32 |
303.171 |
3,03 |
49,37 |
| 21 - JAU | Sugar-cane |
171.929 |
60,28 |
285.206 |
2,85 |
52,22 |
| 17 - ITAPETININGA | Potatoes + Beans |
97.733 |
35,29 |
276.922 |
2,77 |
54,98 |
| 23 - LINS | Type C Milk |
115.248 |
41,87 |
275.196 |
2,75 |
57,73 |
| 30 - PIRACICABA | Sugar-cane |
127.179 |
46,77 |
271.922 |
2,72 |
60,45 |
| 05 - AVARE | Beans + Beef |
99.324 |
36,73 |
270.390 |
2,70 |
63,15 |
| 11 - CATANDUVA | Sugar-cane |
91.170 |
34,47 |
264.477 |
2,64 |
65,79 |
| 38 - SOROCABA | Onion |
80.955 |
33,07 |
244.749 |
2,44 |
68,23 |
| 01 - ANDRADINA | Beef |
131.008 |
54,85 |
238.808 |
2,38 |
70,62 |
| 28 - OURINHOS | Sugar-cane + Coffee |
89.928 |
38,70 |
232.337 |
2,32 |
72,94 |
| 18 - ITAPEVA | Edible Tomatoes |
91.923 |
41,19 |
223.133 |
2,23 |
75,16 |
| 31 - PRESIDENTE PRUDENTE | Beef |
73.598 |
34,75 |
211.777 |
2,11 |
77,28 |
| 39 - TUPA | Eggs |
94.757 |
44,94 |
210.818 |
2,11 |
79,38 |
| 08 - BOTUCATU | Chicken |
70.886 |
33,62 |
210.801 |
2,10 |
81,49 |
| 15 - GENERAL SALGADO | Beef |
65.921 |
32,30 |
204.042 |
2,04 |
83,53 |
| 09 - BRAGANCA PAULISTA | Chicken |
73.460 |
41,34 |
177.672 |
1,77 |
85,30 |
| 25 - MOGI DAS CRUZES | Eggs |
126.610 |
83,84 |
151.002 |
1,51 |
86,81 |
| 10 - CAMPINAS | Chicken |
50.295 |
34,10 |
147.462 |
1,47 |
88,28 |
| 07 - BAURU | Sugar-cane |
43.900 |
30,44 |
144.205 |
1,44 |
89,72 |
| 33 - REGISTRO | Banana |
118.372 |
82,11 |
144.157 |
1,44 |
91,16 |
| 20 - JALES | Beef + Type C Milk |
49.347 |
36,57 |
134.905 |
1,35 |
92,51 |
| 32 - PRESIDENTE VENCESLAU | Beef |
67.071 |
51,19 |
131.002 |
1,31 |
93,82 |
| 40 - VOTUPORANGA | Beef + Sugar-cane |
54.830 |
42,35 |
129.450 |
1,29 |
95,11 |
| 24 - MARILIA | Coffee |
49.033 |
38,98 |
125.764 |
1,26 |
96,36 |
| 13 - FERNANDOPOLIS | Beef + Type C Milk |
39.458 |
36,95 |
106.787 |
1,07 |
97,43 |
| 12 - DRACENA | Beef + Sugar-cane |
45.366 |
42,66 |
106.337 |
1,06 |
98,49 |
| 29 - PINDAMONHAGABA | Type C Milk + Type B Milk |
31.197 |
41,57 |
75.031 |
0,75 |
99,24 |
| 16 - GUARATINGUETA | Type C Milk |
14.698 |
30,77 |
47.756 |
0,48 |
99,72 |
| 37 - SÃO PAULO | Banana |
14.975 |
53,64 |
27.916 |
0,28 |
100,00 |
| ESTADO DE SÃO PAULO | . | . | . |
10.014.397 |
100,00 |
. |
Source: Aucthors’s computations , see text.
TABLE IV. Leading Agricultural Product Total Values in São Paulo State 1996/97, 1997/98 e 1998/99 Crop Years.
| . |
Total
Agricultural Value ( 1,000 R$)1 |
Total Agricultaral
Value (%) | ||||
| Agricultural Product |
1996/97 |
1997/98 |
1998/99 |
1996/97 |
1997/98 |
1998/99 |
| Sugar Cane |
3771591 |
3620514</FONT | ||||
Data de Publicação: 16/04/2001
Autor(es):
Afonso Negri Neto (afonsonegri@yahoo.com.br) Consulte outros textos deste autor
Maura Maria Demétrio Santiago Consulte outros textos deste autor
Alceu Donadelli Consulte outros textos deste autor
Paulo José Coelho (pjcoelho@sp.gov.br) Consulte outros textos deste autor
